
House Prices Prediction
House Prices Prediction. This is a project to practice skills for data exploration and advanced regression techniques.
In this challenge, I’m using a house price dataset from the Kaggle competition and I wanted to explore the data and build a machine learning model that would predict house prices.
Data
The dataset contains 79 explanatory variables that describe (almost) every aspect of residential homes.
Import libraries
import pandas as pd
import matplotlib.pyplot as plt
import seaborn as sns
import numpy as np
from scipy.stats import norm
from sklearn.preprocessing import StandardScaler
from scipy import stats
import warnings
warnings.filterwarnings('ignore')

# Make numpy printouts easier to read.
np.set_printoptions(precision=3, suppress=True)

from sklearn.model_selection import train_test_split
from sklearn.ensemble import RandomForestRegressor
from sklearn.metrics import r2_score

# import libraries
try:
   %tensorflow_version only exists in Colab.
except Exception:
  pass
import tensorflow as tf
from tensorflow import keras
from tensorflow.keras import layers
from tensorflow.keras.layers.experimental import preprocessing
from sklearn.preprocessing import StandardScaler

print(tf.__version__)
Download Dataset
# download dataset from kaggle
! pip install -q kaggle
from google.colab import files
files.upload()
! mkdir ~/.kaggle
! cp kaggle.json ~/.kaggle/
! chmod 600 ~/.kaggle/kaggle.json
! kaggle datasets list
! kaggle competitions download -c house-prices-advanced-regression-techniques
| Id | MSSubClass | MSZoning | LotFrontage | LotArea | Street | Alley | LotShape | LandContour | Utilities | LotConfig | LandSlope | Neighborhood | Condition1 | Condition2 | BldgType | HouseStyle | OverallQual | OverallCond | YearBuilt | YearRemodAdd | RoofStyle | RoofMatl | Exterior1st | Exterior2nd | MasVnrType | MasVnrArea | ExterQual | ExterCond | Foundation | BsmtQual | BsmtCond | BsmtExposure | BsmtFinType1 | BsmtFinSF1 | BsmtFinType2 | BsmtFinSF2 | BsmtUnfSF | TotalBsmtSF | Heating | ... | CentralAir | Electrical | 1stFlrSF | 2ndFlrSF | LowQualFinSF | GrLivArea | BsmtFullBath | BsmtHalfBath | FullBath | HalfBath | BedroomAbvGr | KitchenAbvGr | KitchenQual | TotRmsAbvGrd | Functional | Fireplaces | FireplaceQu | GarageType | GarageYrBlt | GarageFinish | GarageCars | GarageArea | GarageQual | GarageCond | PavedDrive | WoodDeckSF | OpenPorchSF | EnclosedPorch | 3SsnPorch | ScreenPorch | PoolArea | PoolQC | Fence | MiscFeature | MiscVal | MoSold | YrSold | SaleType | SaleCondition | SalePrice | |
|---|---|---|---|---|---|---|---|---|---|---|---|---|---|---|---|---|---|---|---|---|---|---|---|---|---|---|---|---|---|---|---|---|---|---|---|---|---|---|---|---|---|---|---|---|---|---|---|---|---|---|---|---|---|---|---|---|---|---|---|---|---|---|---|---|---|---|---|---|---|---|---|---|---|---|---|---|---|---|---|---|---|
| 0 | 1 | 60 | RL | 65.0 | 8450 | Pave | NaN | Reg | Lvl | AllPub | Inside | Gtl | CollgCr | Norm | Norm | 1Fam | 2Story | 7 | 5 | 2003 | 2003 | Gable | CompShg | VinylSd | VinylSd | BrkFace | 196.0 | Gd | TA | PConc | Gd | TA | No | GLQ | 706 | Unf | 0 | 150 | 856 | GasA | ... | Y | SBrkr | 856 | 854 | 0 | 1710 | 1 | 0 | 2 | 1 | 3 | 1 | Gd | 8 | Typ | 0 | NaN | Attchd | 2003.0 | RFn | 2 | 548 | TA | TA | Y | 0 | 61 | 0 | 0 | 0 | 0 | NaN | NaN | NaN | 0 | 2 | 2008 | WD | Normal | 208500 |
| 1 | 2 | 20 | RL | 80.0 | 9600 | Pave | NaN | Reg | Lvl | AllPub | FR2 | Gtl | Veenker | Feedr | Norm | 1Fam | 1Story | 6 | 8 | 1976 | 1976 | Gable | CompShg | MetalSd | MetalSd | None | 0.0 | TA | TA | CBlock | Gd | TA | Gd | ALQ | 978 | Unf | 0 | 284 | 1262 | GasA | ... | Y | SBrkr | 1262 | 0 | 0 | 1262 | 0 | 1 | 2 | 0 | 3 | 1 | TA | 6 | Typ | 1 | TA | Attchd | 1976.0 | RFn | 2 | 460 | TA | TA | Y | 298 | 0 | 0 | 0 | 0 | 0 | NaN | NaN | NaN | 0 | 5 | 2007 | WD | Normal | 181500 |
| 2 | 3 | 60 | RL | 68.0 | 11250 | Pave | NaN | IR1 | Lvl | AllPub | Inside | Gtl | CollgCr | Norm | Norm | 1Fam | 2Story | 7 | 5 | 2001 | 2002 | Gable | CompShg | VinylSd | VinylSd | BrkFace | 162.0 | Gd | TA | PConc | Gd | TA | Mn | GLQ | 486 | Unf | 0 | 434 | 920 | GasA | ... | Y | SBrkr | 920 | 866 | 0 | 1786 | 1 | 0 | 2 | 1 | 3 | 1 | Gd | 6 | Typ | 1 | TA | Attchd | 2001.0 | RFn | 2 | 608 | TA | TA | Y | 0 | 42 | 0 | 0 | 0 | 0 | NaN | NaN | NaN | 0 | 9 | 2008 | WD | Normal | 223500 |
| 3 | 4 | 70 | RL | 60.0 | 9550 | Pave | NaN | IR1 | Lvl | AllPub | Corner | Gtl | Crawfor | Norm | Norm | 1Fam | 2Story | 7 | 5 | 1915 | 1970 | Gable | CompShg | Wd Sdng | Wd Shng | None | 0.0 | TA | TA | BrkTil | TA | Gd | No | ALQ | 216 | Unf | 0 | 540 | 756 | GasA | ... | Y | SBrkr | 961 | 756 | 0 | 1717 | 1 | 0 | 1 | 0 | 3 | 1 | Gd | 7 | Typ | 1 | Gd | Detchd | 1998.0 | Unf | 3 | 642 | TA | TA | Y | 0 | 35 | 272 | 0 | 0 | 0 | NaN | NaN | NaN | 0 | 2 | 2006 | WD | Abnorml | 140000 |
| 4 | 5 | 60 | RL | 84.0 | 14260 | Pave | NaN | IR1 | Lvl | AllPub | FR2 | Gtl | NoRidge | Norm | Norm | 1Fam | 2Story | 8 | 5 | 2000 | 2000 | Gable | CompShg | VinylSd | VinylSd | BrkFace | 350.0 | Gd | TA | PConc | Gd | TA | Av | GLQ | 655 | Unf | 0 | 490 | 1145 | GasA | ... | Y | SBrkr | 1145 | 1053 | 0 | 2198 | 1 | 0 | 2 | 1 | 4 | 1 | Gd | 9 | Typ | 1 | TA | Attchd | 2000.0 | RFn | 3 | 836 | TA | TA | Y | 192 | 84 | 0 | 0 | 0 | 0 | NaN | NaN | NaN | 0 | 12 | 2008 | WD | Normal | 250000 |
| ... | ... | ... | ... | ... | ... | ... | ... | ... | ... | ... | ... | ... | ... | ... | ... | ... | ... | ... | ... | ... | ... | ... | ... | ... | ... | ... | ... | ... | ... | ... | ... | ... | ... | ... | ... | ... | ... | ... | ... | ... | ... | ... | ... | ... | ... | ... | ... | ... | ... | ... | ... | ... | ... | ... | ... | ... | ... | ... | ... | ... | ... | ... | ... | ... | ... | ... | ... | ... | ... | ... | ... | ... | ... | ... | ... | ... | ... | ... | ... | ... | ... |
| 1455 | 1456 | 60 | RL | 62.0 | 7917 | Pave | NaN | Reg | Lvl | AllPub | Inside | Gtl | Gilbert | Norm | Norm | 1Fam | 2Story | 6 | 5 | 1999 | 2000 | Gable | CompShg | VinylSd | VinylSd | None | 0.0 | TA | TA | PConc | Gd | TA | No | Unf | 0 | Unf | 0 | 953 | 953 | GasA | ... | Y | SBrkr | 953 | 694 | 0 | 1647 | 0 | 0 | 2 | 1 | 3 | 1 | TA | 7 | Typ | 1 | TA | Attchd | 1999.0 | RFn | 2 | 460 | TA | TA | Y | 0 | 40 | 0 | 0 | 0 | 0 | NaN | NaN | NaN | 0 | 8 | 2007 | WD | Normal | 175000 |
| 1456 | 1457 | 20 | RL | 85.0 | 13175 | Pave | NaN | Reg | Lvl | AllPub | Inside | Gtl | NWAmes | Norm | Norm | 1Fam | 1Story | 6 | 6 | 1978 | 1988 | Gable | CompShg | Plywood | Plywood | Stone | 119.0 | TA | TA | CBlock | Gd | TA | No | ALQ | 790 | Rec | 163 | 589 | 1542 | GasA | ... | Y | SBrkr | 2073 | 0 | 0 | 2073 | 1 | 0 | 2 | 0 | 3 | 1 | TA | 7 | Min1 | 2 | TA | Attchd | 1978.0 | Unf | 2 | 500 | TA | TA | Y | 349 | 0 | 0 | 0 | 0 | 0 | NaN | MnPrv | NaN | 0 | 2 | 2010 | WD | Normal | 210000 |
| 1457 | 1458 | 70 | RL | 66.0 | 9042 | Pave | NaN | Reg | Lvl | AllPub | Inside | Gtl | Crawfor | Norm | Norm | 1Fam | 2Story | 7 | 9 | 1941 | 2006 | Gable | CompShg | CemntBd | CmentBd | None | 0.0 | Ex | Gd | Stone | TA | Gd | No | GLQ | 275 | Unf | 0 | 877 | 1152 | GasA | ... | Y | SBrkr | 1188 | 1152 | 0 | 2340 | 0 | 0 | 2 | 0 | 4 | 1 | Gd | 9 | Typ | 2 | Gd | Attchd | 1941.0 | RFn | 1 | 252 | TA | TA | Y | 0 | 60 | 0 | 0 | 0 | 0 | NaN | GdPrv | Shed | 2500 | 5 | 2010 | WD | Normal | 266500 |
| 1458 | 1459 | 20 | RL | 68.0 | 9717 | Pave | NaN | Reg | Lvl | AllPub | Inside | Gtl | NAmes | Norm | Norm | 1Fam | 1Story | 5 | 6 | 1950 | 1996 | Hip | CompShg | MetalSd | MetalSd | None | 0.0 | TA | TA | CBlock | TA | TA | Mn | GLQ | 49 | Rec | 1029 | 0 | 1078 | GasA | ... | Y | FuseA | 1078 | 0 | 0 | 1078 | 1 | 0 | 1 | 0 | 2 | 1 | Gd | 5 | Typ | 0 | NaN | Attchd | 1950.0 | Unf | 1 | 240 | TA | TA | Y | 366 | 0 | 112 | 0 | 0 | 0 | NaN | NaN | NaN | 0 | 4 | 2010 | WD | Normal | 142125 |
| 1459 | 1460 | 20 | RL | 75.0 | 9937 | Pave | NaN | Reg | Lvl | AllPub | Inside | Gtl | Edwards | Norm | Norm | 1Fam | 1Story | 5 | 6 | 1965 | 1965 | Gable | CompShg | HdBoard | HdBoard | None | 0.0 | Gd | TA | CBlock | TA | TA | No | BLQ | 830 | LwQ | 290 | 136 | 1256 | GasA | ... | Y | SBrkr | 1256 | 0 | 0 | 1256 | 1 | 0 | 1 | 1 | 3 | 1 | TA | 6 | Typ | 0 | NaN | Attchd | 1965.0 | Fin | 1 | 276 | TA | TA | Y | 736 | 68 | 0 | 0 | 0 | 0 | NaN | NaN | NaN | 0 | 6 | 2008 | WD | Normal | 147500 |
1460 rows × 81 columns
Explore Data
Explore each feature.
<class 'pandas.core.frame.DataFrame'>
RangeIndex: 1460 entries, 0 to 1459
Data columns (total 81 columns):
 #   Column         Non-Null Count  Dtype
---  ------         --------------  -----
 0   Id             1460 non-null   int64
 1   MSSubClass     1460 non-null   int64
 2   MSZoning       1460 non-null   object
 3   LotFrontage    1201 non-null   float64
 4   LotArea        1460 non-null   int64
 5   Street         1460 non-null   object
 6   Alley          91 non-null     object
 7   LotShape       1460 non-null   object
 8   LandContour    1460 non-null   object
 9   Utilities      1460 non-null   object
 10  LotConfig      1460 non-null   object
 11  LandSlope      1460 non-null   object
 12  Neighborhood   1460 non-null   object
 13  Condition1     1460 non-null   object
 14  Condition2     1460 non-null   object
 15  BldgType       1460 non-null   object
 16  HouseStyle     1460 non-null   object
 17  OverallQual    1460 non-null   int64
 18  OverallCond    1460 non-null   int64
 19  YearBuilt      1460 non-null   int64
 20  YearRemodAdd   1460 non-null   int64
 21  RoofStyle      1460 non-null   object
 22  RoofMatl       1460 non-null   object
 23  Exterior1st    1460 non-null   object
 24  Exterior2nd    1460 non-null   object
 25  MasVnrType     1452 non-null   object
 26  MasVnrArea     1452 non-null   float64
 27  ExterQual      1460 non-null   object
 28  ExterCond      1460 non-null   object
 29  Foundation     1460 non-null   object
 30  BsmtQual       1423 non-null   object
 31  BsmtCond       1423 non-null   object
 32  BsmtExposure   1422 non-null   object
 33  BsmtFinType1   1423 non-null   object
 34  BsmtFinSF1     1460 non-null   int64
 35  BsmtFinType2   1422 non-null   object
 36  BsmtFinSF2     1460 non-null   int64
 37  BsmtUnfSF      1460 non-null   int64
 38  TotalBsmtSF    1460 non-null   int64
 39  Heating        1460 non-null   object
 40  HeatingQC      1460 non-null   object
 41  CentralAir     1460 non-null   object
 42  Electrical     1459 non-null   object
 43  1stFlrSF       1460 non-null   int64
 44  2ndFlrSF       1460 non-null   int64
 45  LowQualFinSF   1460 non-null   int64
 46  GrLivArea      1460 non-null   int64
 47  BsmtFullBath   1460 non-null   int64
 48  BsmtHalfBath   1460 non-null   int64
 49  FullBath       1460 non-null   int64
 50  HalfBath       1460 non-null   int64
 51  BedroomAbvGr   1460 non-null   int64
 52  KitchenAbvGr   1460 non-null   int64
 53  KitchenQual    1460 non-null   object
 54  TotRmsAbvGrd   1460 non-null   int64
 55  Functional     1460 non-null   object
 56  Fireplaces     1460 non-null   int64
 57  FireplaceQu    770 non-null    object
 58  GarageType     1379 non-null   object
 59  GarageYrBlt    1379 non-null   float64
 60  GarageFinish   1379 non-null   object
 61  GarageCars     1460 non-null   int64
 62  GarageArea     1460 non-null   int64
 63  GarageQual     1379 non-null   object
 64  GarageCond     1379 non-null   object
 65  PavedDrive     1460 non-null   object
 66  WoodDeckSF     1460 non-null   int64
 67  OpenPorchSF    1460 non-null   int64
 68  EnclosedPorch  1460 non-null   int64
 69  3SsnPorch      1460 non-null   int64
 70  ScreenPorch    1460 non-null   int64
 71  PoolArea       1460 non-null   int64
 72  PoolQC         7 non-null      object
 73  Fence          281 non-null    object
 74  MiscFeature    54 non-null     object
 75  MiscVal        1460 non-null   int64
 76  MoSold         1460 non-null   int64
 77  YrSold         1460 non-null   int64
 78  SaleType       1460 non-null   object
 79  SaleCondition  1460 non-null   object
 80  SalePrice      1460 non-null   int64
dtypes: float64(3), int64(35), object(43)
memory usage: 924.0+ KB
The Saleprice is the reason for our forecast.
Analyze the SalePrice column.
count      1460.000000
mean     180921.195890
std       79442.502883
min       34900.000000
25%      129975.000000
50%      163000.000000
75%      214000.000000
max      755000.000000
Name: SalePrice, dtype: float64
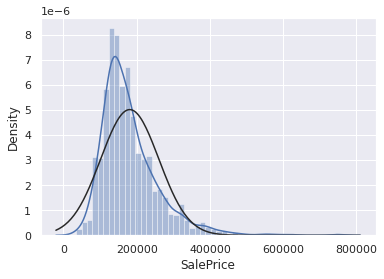
Displays a histogram of the SalePrice column.
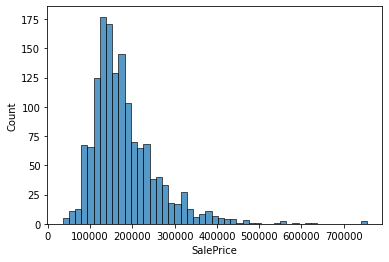
Skewness: 1.882876
Kurtosis: 6.536282
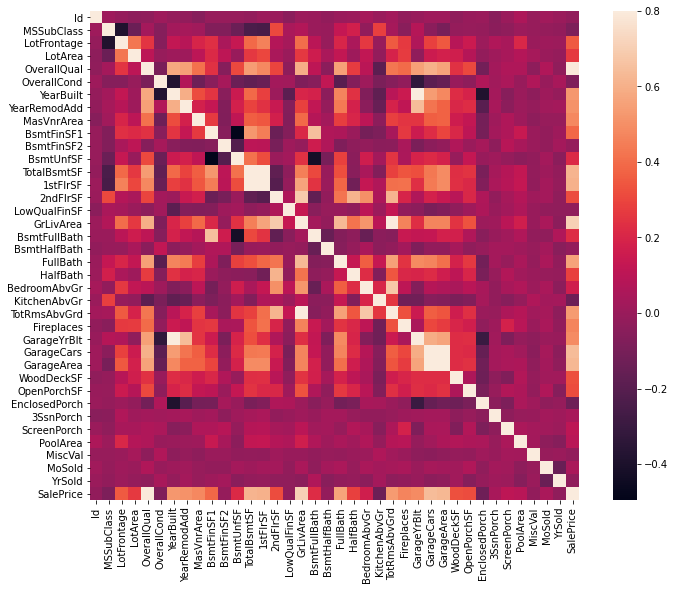
Correlation matrix (heatmap style)
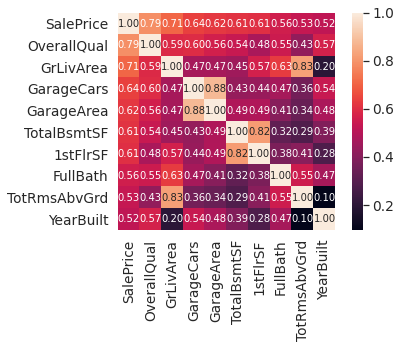
SalePrice correlation matrix (zoomed heatmap style)
In the SalePrice correlation matrix (zoomed heat map style) I see three orange-colored squares that get my attention. The first refers to the TotalBsmtSF and 1stFlrSF variables, and the second refers to the GarageCar and GarageArea variables, and the third refers to the GrLivArea and TotRmsAbvGrd variables. These cases show how significant the correlation is between these variables. We can conclude that these variables give almost the same information.
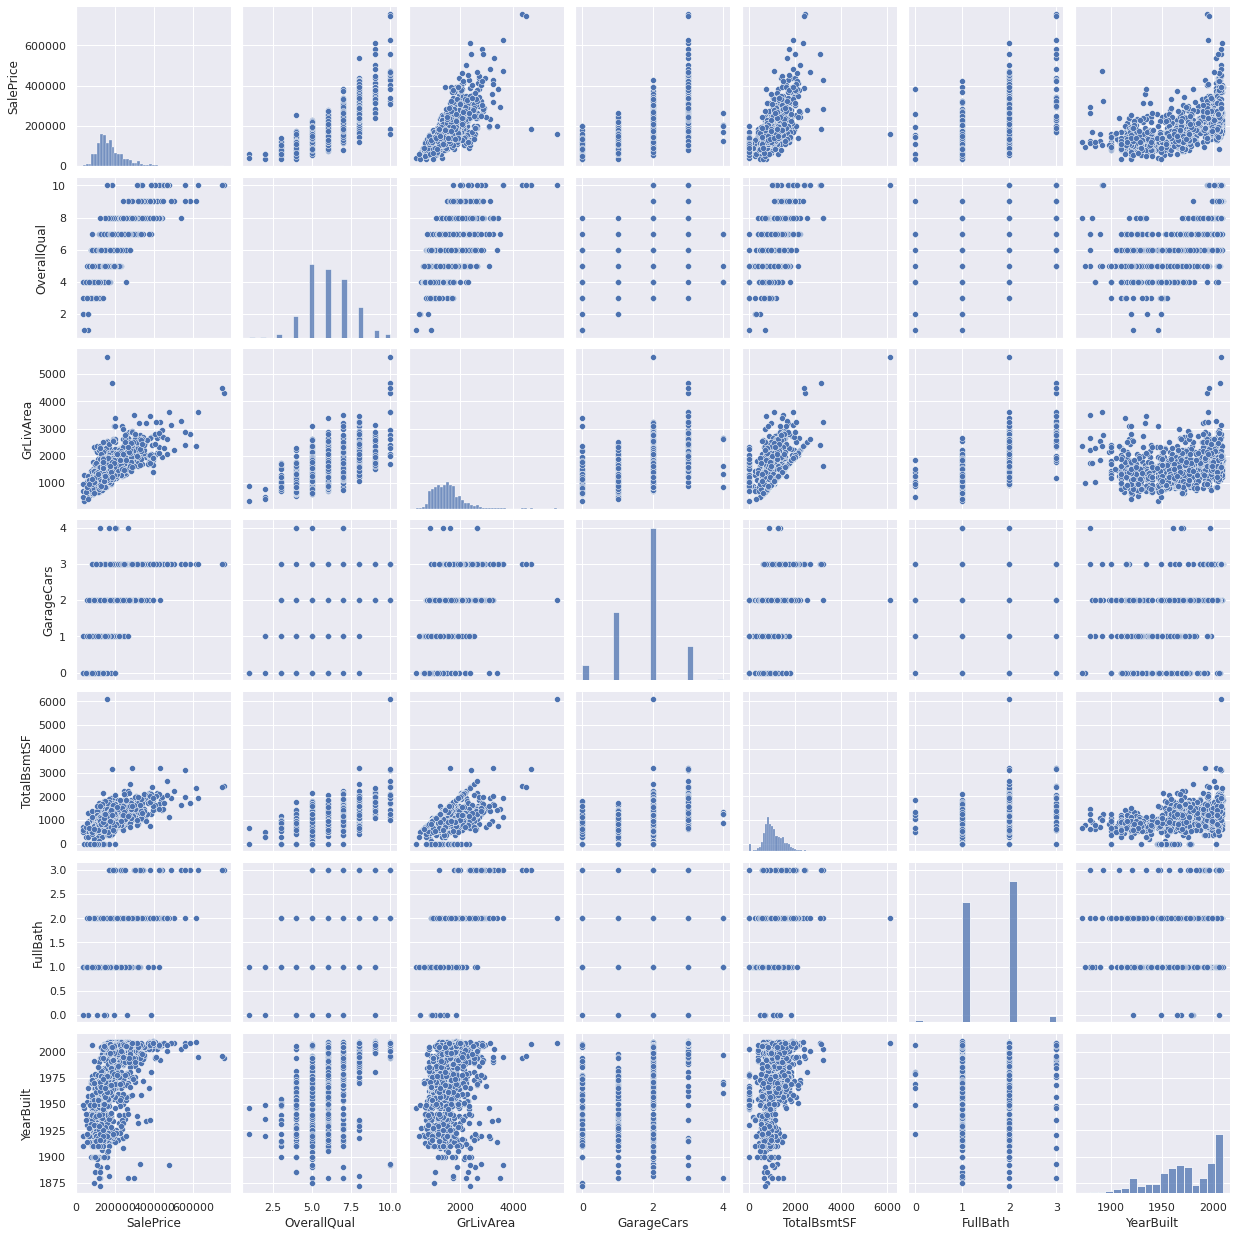
Scatter plots between the most correlated
According to the ‘alePrice correlation matrix, these are the variables most correlated with SalePrice. Therefore, I have chosen the variables to be analyzed:
OverallQual,GrLivAreaandTotalBsmtSFare strongly correlated withSalePrice.GarageCarsandGarageAreaare some of the most strongly correlated variables and are similar. Therefore, we need one of these variables in our analysis. That’s theGarageCarsvariable.TotalBsmtSFand1stFloorare also similar variables. Therefore, I keepTotalBsmtSF.FullBathTotRmsAbvGrdandGrLivAreaare also similar variables. Therefore, I keepGrLivArea.YearBuiltis slightly correlated withSalePrice.
Scatter plots between SalePrice and correlated variables
Missing data
Calculates the null values for each column.
| Total | Percent | |
|---|---|---|
| PoolQC | 1453 | 0.995205 |
| MiscFeature | 1406 | 0.963014 |
| Alley | 1369 | 0.937671 |
| Fence | 1179 | 0.807534 |
| FireplaceQu | 690 | 0.472603 |
| LotFrontage | 259 | 0.177397 |
| GarageCond | 81 | 0.055479 |
| GarageType | 81 | 0.055479 |
| GarageYrBlt | 81 | 0.055479 |
| GarageFinish | 81 | 0.055479 |
| GarageQual | 81 | 0.055479 |
| BsmtExposure | 38 | 0.026027 |
| BsmtFinType2 | 38 | 0.026027 |
| BsmtFinType1 | 37 | 0.025342 |
| BsmtCond | 37 | 0.025342 |
| BsmtQual | 37 | 0.025342 |
| MasVnrArea | 8 | 0.005479 |
| MasVnrType | 8 | 0.005479 |
| Electrical | 1 | 0.000685 |
| Utilities | 0 | 0.000000 |
From the sum of the calculated null values. I deleted a column with over one null value and delete one row where the Electrical column is null.
Normalization
Histogram - Kurtosis and skewness.
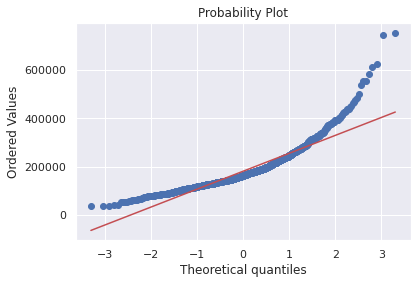
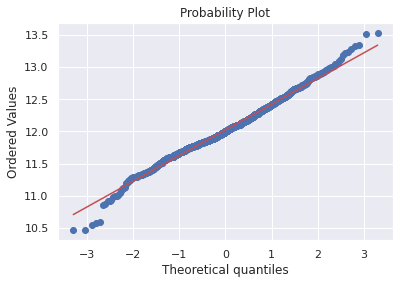
Normal probability plot - Data distribution should closely follow the diagonal that represents the normal distribution.
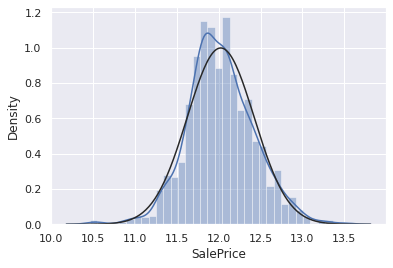
Applying log transformation.
Convert categorical variable into numeric variable
| Id | MSSubClass | LotArea | OverallQual | OverallCond | YearBuilt | YearRemodAdd | BsmtFinSF1 | BsmtFinSF2 | BsmtUnfSF | TotalBsmtSF | 1stFlrSF | 2ndFlrSF | LowQualFinSF | GrLivArea | BsmtFullBath | BsmtHalfBath | FullBath | HalfBath | BedroomAbvGr | KitchenAbvGr | TotRmsAbvGrd | Fireplaces | GarageCars | GarageArea | WoodDeckSF | OpenPorchSF | EnclosedPorch | 3SsnPorch | ScreenPorch | PoolArea | MiscVal | MoSold | YrSold | SalePrice | HasBsmt | MSZoning_C (all) | MSZoning_FV | MSZoning_RH | MSZoning_RL | ... | HeatingQC_Fa | HeatingQC_Gd | HeatingQC_Po | HeatingQC_TA | CentralAir_N | CentralAir_Y | Electrical_FuseA | Electrical_FuseF | Electrical_FuseP | Electrical_Mix | Electrical_SBrkr | KitchenQual_Ex | KitchenQual_Fa | KitchenQual_Gd | KitchenQual_TA | Functional_Maj1 | Functional_Maj2 | Functional_Min1 | Functional_Min2 | Functional_Mod | Functional_Sev | Functional_Typ | PavedDrive_N | PavedDrive_P | PavedDrive_Y | SaleType_COD | SaleType_CWD | SaleType_Con | SaleType_ConLD | SaleType_ConLI | SaleType_ConLw | SaleType_New | SaleType_Oth | SaleType_WD | SaleCondition_Abnorml | SaleCondition_AdjLand | SaleCondition_Alloca | SaleCondition_Family | SaleCondition_Normal | SaleCondition_Partial | |
|---|---|---|---|---|---|---|---|---|---|---|---|---|---|---|---|---|---|---|---|---|---|---|---|---|---|---|---|---|---|---|---|---|---|---|---|---|---|---|---|---|---|---|---|---|---|---|---|---|---|---|---|---|---|---|---|---|---|---|---|---|---|---|---|---|---|---|---|---|---|---|---|---|---|---|---|---|---|---|---|---|---|
| 0 | 1 | 60 | 8450 | 7 | 5 | 2003 | 2003 | 706 | 0 | 150 | 6.752270 | 856 | 854 | 0 | 7.444249 | 1 | 0 | 2 | 1 | 3 | 1 | 8 | 0 | 2 | 548 | 0 | 61 | 0 | 0 | 0 | 0 | 0 | 2 | 2008 | 12.247694 | 1 | 0 | 0 | 0 | 1 | ... | 0 | 0 | 0 | 0 | 0 | 1 | 0 | 0 | 0 | 0 | 1 | 0 | 0 | 1 | 0 | 0 | 0 | 0 | 0 | 0 | 0 | 1 | 0 | 0 | 1 | 0 | 0 | 0 | 0 | 0 | 0 | 0 | 0 | 1 | 0 | 0 | 0 | 0 | 1 | 0 |
| 1 | 2 | 20 | 9600 | 6 | 8 | 1976 | 1976 | 978 | 0 | 284 | 7.140453 | 1262 | 0 | 0 | 7.140453 | 0 | 1 | 2 | 0 | 3 | 1 | 6 | 1 | 2 | 460 | 298 | 0 | 0 | 0 | 0 | 0 | 0 | 5 | 2007 | 12.109011 | 1 | 0 | 0 | 0 | 1 | ... | 0 | 0 | 0 | 0 | 0 | 1 | 0 | 0 | 0 | 0 | 1 | 0 | 0 | 0 | 1 | 0 | 0 | 0 | 0 | 0 | 0 | 1 | 0 | 0 | 1 | 0 | 0 | 0 | 0 | 0 | 0 | 0 | 0 | 1 | 0 | 0 | 0 | 0 | 1 | 0 |
| 2 | 3 | 60 | 11250 | 7 | 5 | 2001 | 2002 | 486 | 0 | 434 | 6.824374 | 920 | 866 | 0 | 7.487734 | 1 | 0 | 2 | 1 | 3 | 1 | 6 | 1 | 2 | 608 | 0 | 42 | 0 | 0 | 0 | 0 | 0 | 9 | 2008 | 12.317167 | 1 | 0 | 0 | 0 | 1 | ... | 0 | 0 | 0 | 0 | 0 | 1 | 0 | 0 | 0 | 0 | 1 | 0 | 0 | 1 | 0 | 0 | 0 | 0 | 0 | 0 | 0 | 1 | 0 | 0 | 1 | 0 | 0 | 0 | 0 | 0 | 0 | 0 | 0 | 1 | 0 | 0 | 0 | 0 | 1 | 0 |
| 3 | 4 | 70 | 9550 | 7 | 5 | 1915 | 1970 | 216 | 0 | 540 | 6.628041 | 961 | 756 | 0 | 7.448334 | 1 | 0 | 1 | 0 | 3 | 1 | 7 | 1 | 3 | 642 | 0 | 35 | 272 | 0 | 0 | 0 | 0 | 2 | 2006 | 11.849398 | 1 | 0 | 0 | 0 | 1 | ... | 0 | 1 | 0 | 0 | 0 | 1 | 0 | 0 | 0 | 0 | 1 | 0 | 0 | 1 | 0 | 0 | 0 | 0 | 0 | 0 | 0 | 1 | 0 | 0 | 1 | 0 | 0 | 0 | 0 | 0 | 0 | 0 | 0 | 1 | 1 | 0 | 0 | 0 | 0 | 0 |
| 4 | 5 | 60 | 14260 | 8 | 5 | 2000 | 2000 | 655 | 0 | 490 | 7.043160 | 1145 | 1053 | 0 | 7.695303 | 1 | 0 | 2 | 1 | 4 | 1 | 9 | 1 | 3 | 836 | 192 | 84 | 0 | 0 | 0 | 0 | 0 | 12 | 2008 | 12.429216 | 1 | 0 | 0 | 0 | 1 | ... | 0 | 0 | 0 | 0 | 0 | 1 | 0 | 0 | 0 | 0 | 1 | 0 | 0 | 1 | 0 | 0 | 0 | 0 | 0 | 0 | 0 | 1 | 0 | 0 | 1 | 0 | 0 | 0 | 0 | 0 | 0 | 0 | 0 | 1 | 0 | 0 | 0 | 0 | 1 | 0 |
5 rows × 222 columns
Model
Random Forest Regression
- Identify your dependent (y) and independent variables (x)
- Split the dataset into the Training set and Test set
- Training the Random Forest Regression model on the whole dataset
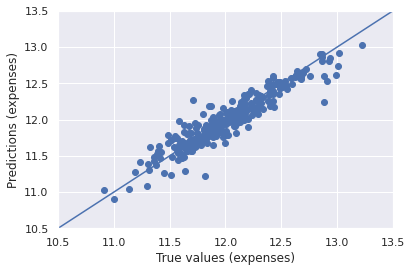
- Predicting the Test set results R² score : 0.8721889818394666
The graph displays the predicted values and the actual values.
Conclusion
In this project, we explore the dataset and analysts SalePrice variable with the most correlated variables, we clean up missing data and outliers. We normalize data with statistics. We also converted categorical variables to numeric variables. After that, we used a Random Forest Regression model to predict house prices.