
Clustering Sub-district in Bangkok, Thailand
1. Introduction
Background
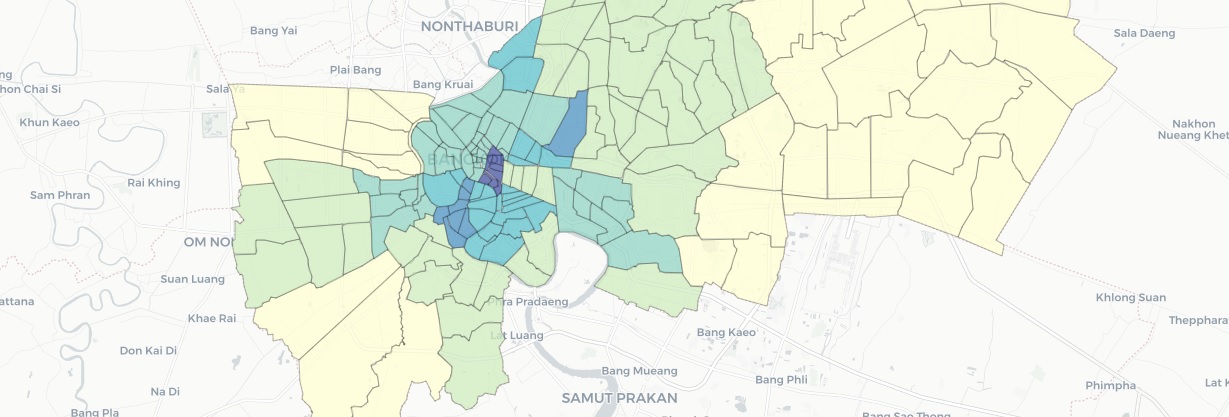
Bangkok is the capital and most populous city of Thailand. It is known in Thai as Krung Thep Maha Nakhon or simply Krung Thep. The city occupies 1,568.7 square kilometers (605.7 sq mi) in the Chao Phraya River delta in central Thailand and has an estimated population of 10.539 million as of 2020, 15.3 percent of the country’s population. Over fourteen million people (22.2 percent) lived within the surrounding Bangkok Metropolitan Region at the 2010 census, making Bangkok an extremely primate city, dwarfing Thailand’s other urban centers in both size and importance to the national economy.
Business Problem
How to find a suitable restaurant business location in Bangkok?
From the information, Bangkok is the city with the highest population density in Thailand. There are many buildings and meeting places. Therefore, it is interesting for investors to build a business, specifically a restaurant business. But it is difficult to find the suitable place for the restaurant location. The problem with stakeholders is finding a place with less restaurant density and high population density. Therefore, in this project, we will use data science methods to analyze the data to display the results for stakeholders to consider as part of business decision-making.
Interest
Investors interested in investing, and stakeholders will be interested in this project. And take this as part of your investment consideration. Once we have analyzed the existing data and solved these problems with machine learning methods. Then create a map and visualized group each district of population density and restaurants density.
2. Data
2.1 Data Requirements
From business problems, we have determined the required feature of the data. These include population density and restaurant density. to be used as input to the clustering algorithm model to categorize the sub-districts.
2.2 Data Collection
The data to be processed includes:
-
Population data - I discover population data of each district in Bangkok from the Thailand Digital Government Development Agency (DGA)[2] , which this uses for calculating population density.
- Boundary coordinates - I searched for a Bangkok boundary file or a GeoJson file to create a choropleth map. However, I discovered a Thailand administrative region - sub from data.humdata.org[3] as a shapefile (.shp) containing the coordinates of all cities of Thailand. So, I selected only the properties that I required, which were Bangkok’s coordinates, and save it as a GeoJson file to reduce the file size and flexibility in working.
- Sub-district location coordinates - I use the Bangkok dataset from the Thailand Digital Government Development Agency (DGA)[4] , which contains the longitude and latitude coordinates for each sub-district in Bangkok.
- Foursquare API - I used Foursquare API[5] to get the restaurant’s neighborhood given coordinates center point for each sub-district of Bangkok.
I will divide the data into two parts. The first part uses population data and Bangkok boundary coordinates to calculate the population density. The second part uses the district location coordinates as input to the Foursquare API to find restaurants within a radius of 500 meters from the location coordinates.
3. Data Preparation
3.1 Cleaning data
Combine downloaded data from multiple parts into two parts. The first data segment contains sub-district ID, sub-district name, district ID, district name, latitude coordinates, longitude coordinates, population, and shape area. The second data segment contains sub-district id, sub-district name, and geometry. We will use the first data segment is used to analyze to calculate population density and restaurant density. And the second data segment to create a GeoJson file for the visualize choropleth map.
The first data segment contains the number of sub-district ID is 170 records. I found a problem with 10 records missing values in latitude coordinates, longitude columns. From the analysis we cannot drop it because the data is will not synchronize with the choropleth map, so we use the geopy library to find the missing latitude, longitude coordinates by passing the sub-district name and district name values as input strings to the geopy library. Save the file after cleaning the data to reduce the above steps in the next run.
3.2 Calculate Population Density
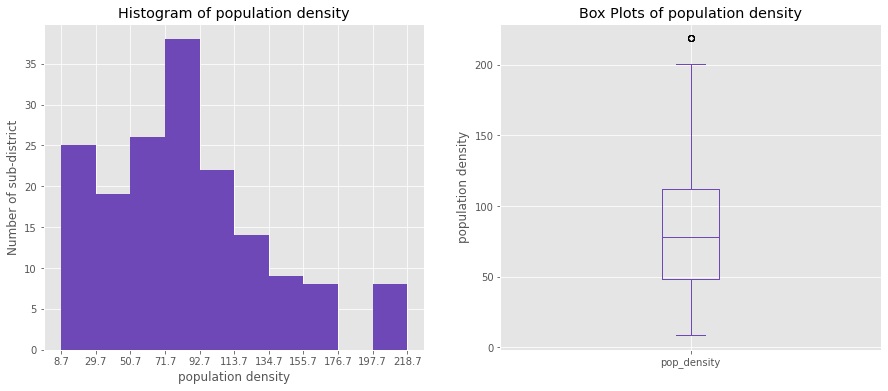
From the first data segment or sub-district metadata table, I take the population column divided by the shape area column to get people per square kilometer or population density and change the scale to people per square meter, then concatenation population density column to the sub-district metadata table.
In Figure 1, the histogram and box plot of the population density visualize the population density. It was calculated from 170 sub-districts. The frequency distribution of the population density was mostly in the range of 71.7 - 92.7 people per square meter. And the interquartile range is 50 - 110 people per square meter.
3.3 Calculate Restaurant Density
I pass the latitude and longitude coordinates of each sub-district as input to the Foursquare API to find a neighborhood venue within a 500m radius from the input coordinates. And I limit the search to 200 venues in each sub-district. and then return the value as a venue table.
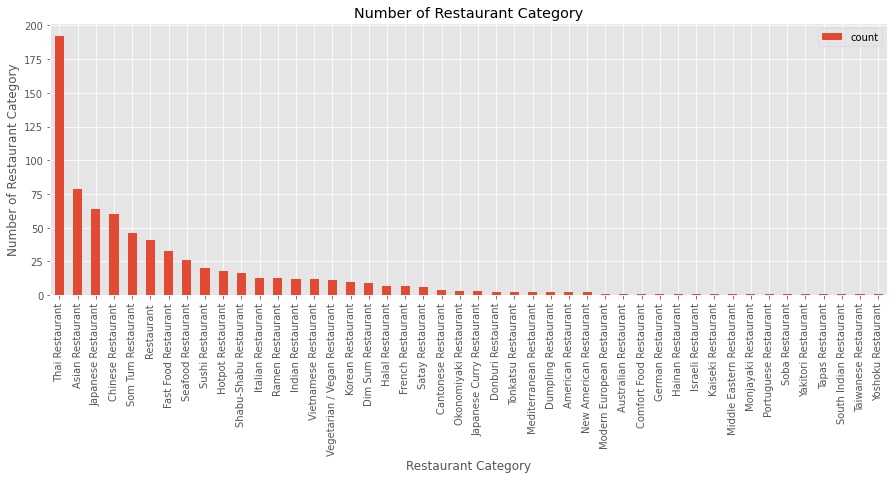
For a list of restaurant data, I drop duplicate venues ID and keep venues that are distant closest to the sub-district coordinates, then explore and select only the restaurant category. The results return from the Foursquare API for restaurants are 733 restaurants and 46 unique categories. See Figure 2. Then calculate the restaurant density, I divided the number of restaurants in each sub-district by the circled area of 500m radius, then concatenation restaurant density column to the sub-district metadata table.
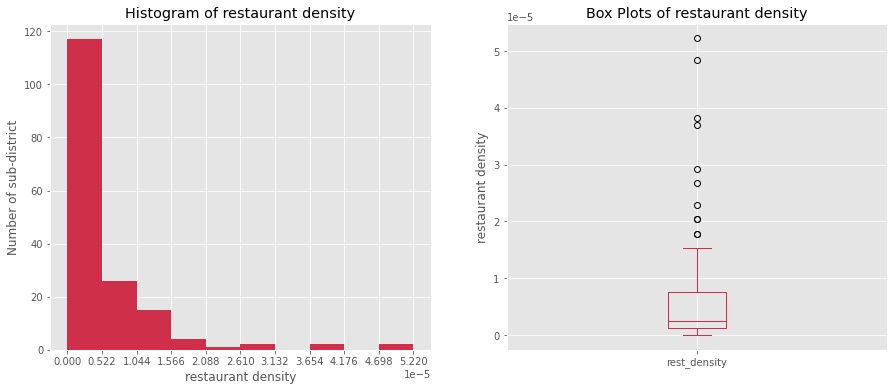
In Figure 4, the histogram and box plot of the restaurant density visualize the restaurant density. It was calculated from 170 sub-districts. The frequency distribution of the restaurant density was mostly in the range of 0 - 0.522 restaurants per square meter. And the interquartile range is 0 - 1 restaurant per square meter.
3.4 Correlation between population density and restaurant density
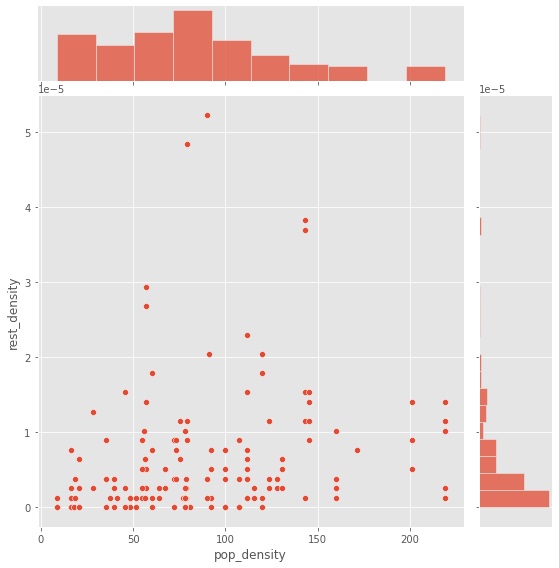
In Figure 4, the scatter plot of correlation between population density and restaurant density visualizes a relation where the x-axis is the population density, and the y-axis variable is the restaurant density. The figure illustrates that most of the data is distributed along the x-axis rather than the y-axis.
4. Model
Before passing the dataset into the models, using the Z-Score method normalizes the data. Because the scale of each feature is different. Z-Score Formula: Z= (x- μ)/σ
4.1 K-Mean Clustering Algorithm
The first method chose k-mean clustering, which is an unsupervised learning type of machine learning algorithm because our problem was to cluster the sub-district data and our dataset is untagged data.
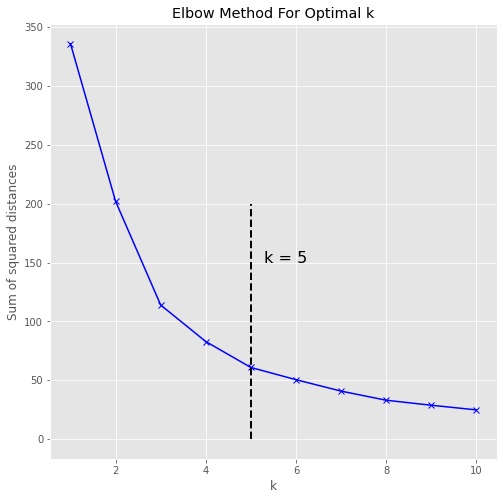
The first step for the k-mean algorithm is to determine the optimal number of clusters. The Elbow Method is one of the most popular methods to determine this optimal value of k. See Figure 5. To determine the optimal number of clusters, we have to select the value of k at the “elbow”. Therefore, for this dataset, I decided that the optimal number of clusters for the data is 5.
4.2 Mean-Shift Clustering Algorithm
The second method I use is Mean-Shift algorithm because of the Mean-Shift algorithm used in scikits.learn.feature_extraction module takes the shape matrix [n_samples, n_features] as input, which is the same as K-mean algorithms
Mean-Shift clusters data by estimating blobs in a smooth density of points matrix. This algorithm automatically sets its numbers of cluster. It will have difficulties scaling to thousands of samples.[6] For this dataset, the estimated number of clusters after passing the Mean-Shift model is 6.
5. Results
5.1 K-Mean Clustering Algorithm
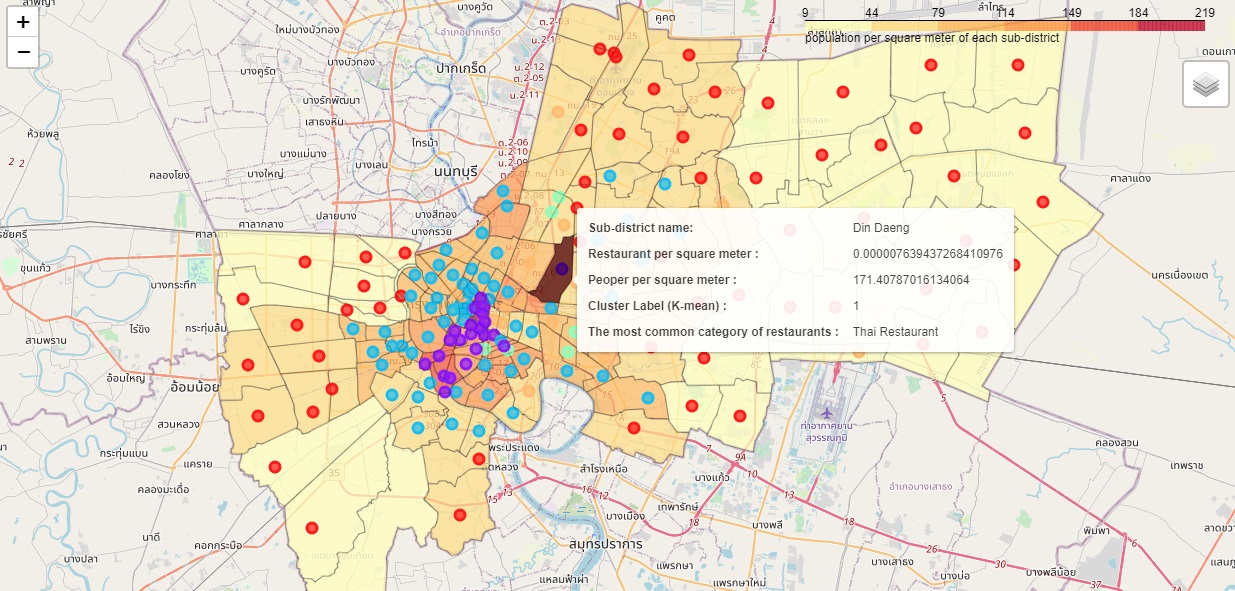
The result from the k-mean model and the number of clusters was 5 (k=5) considering the k-value from the Elbow Method. In Figure 6, visualize the resulting clusters on the choropleth map. On the map, when hovering over a sub-district area of interest, it displays a text label sub-district name, restaurant per square meter, population per square meter, cluster label (K-mean), and the most common category of restaurants.
5.2 Mean-Shift Clustering Algorithm
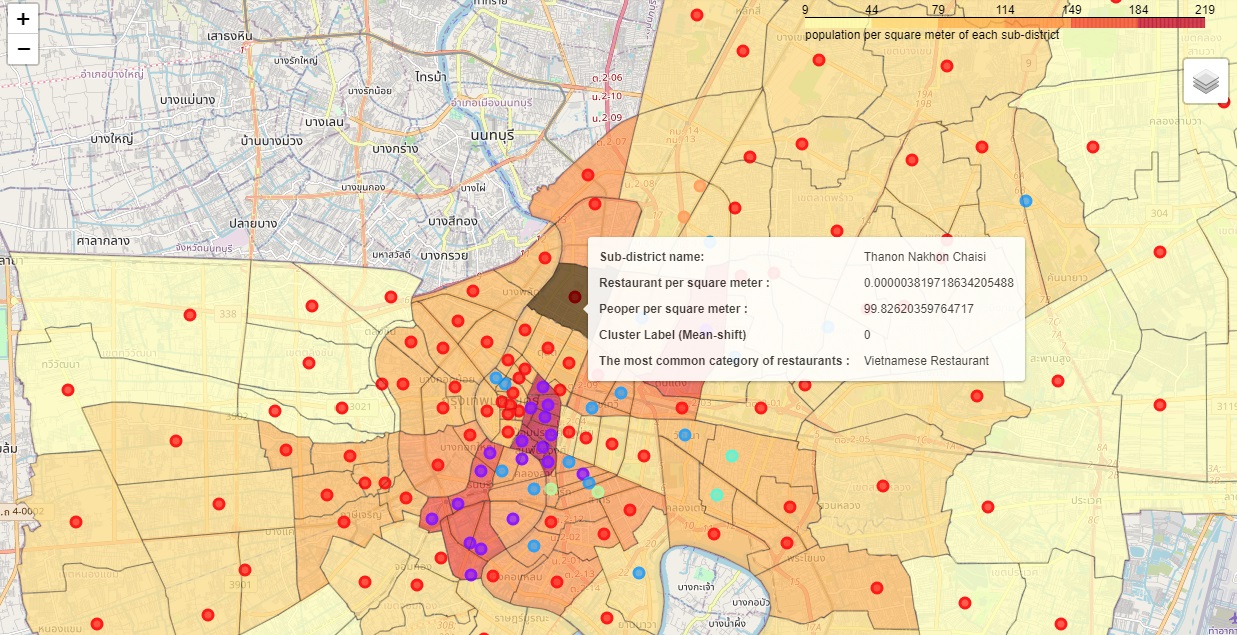
The results from the mean-shift model and the number of estimated clusters are 6. In Figure 7, visualize the resulting clusters on the choropleth map. On the map, when hovering over a sub-district area of interest, it displays a text label sub-district name, restaurant per square meter, population per square meter, cluster label (Mean-shift), and the most common category of restaurants.
6. Discussion
From a problem is clustering sub-district in Bangkok and there are two solutions I have selected: the first method is K-Mean clustering, which is the most popular method. In order to train the model with my dataset, which is a small dataset (170 samples) and it is difficult to select the suitable k. So, I chose the second method which is Mean-Shift clustering, which is appropriate for a small dataset and does not set the number of clusters.
However, the model imported dataset has only 2 features, which are very minimal. So, in order to improve this project in the future, I plan to add more analytical features.
7. Conclusion
In this study, I am trying to cluster the sub-district in Bangkok as an informative decision for investors to build a business, especially a restaurant business. It considers two features: population density and restaurant density. However, the restaurant data that we analyzed is taken from the Foursquare API, which only retrieves the restaurants that are online on the Foursquare platform, so there are many offline restaurants that have not been considered. This is an important part that we must continue to improve. However, in this study, it is still beneficial to the creators and those who are interested in bringing this concept to the next level.
8. Reference
- [1] https://en.wikipedia.org/wiki/Bangkok
- [2] Population data - https://data.go.th/dataset
- [3] Thailand administrative region - https://data.humdata.org
- [4] Sub-district location coordinates - https://data.go.th/dataset
- [5] Foursquare API - https://foursquare.com
- [6] Mean-Shift - https://scikit-learn.org/